


Glass transition temperature describes when segmental motion in amorphous material becomes apparent on a test’s time scale. The reported Tg depends on the signal, curve criterion, and history of the specimen. It’s neither a melting point nor a stand-alone service temperature.
A supplier’s thermal report and a laboratory’s mechanical report can both be correct while giving different Tg values. Before comparing their temperature values, understand what each test observed. In order to measure the glass transition temperature meaningfully, laboratories must define what they observed. This guide allows us to follow molecular motion in a measurement, and then teaches us how to compare reports without creating a general conversion factor.
Quick reference: reading a Tg report
- Material region: amorphous polymer segments, including amorphous regions within semi-crystalline polymers.
- Thermal signal: a heat capacity step measured by differential scanning calorimetry.
- Mechanical signal: changes in storage modulus, loss modulus or damping.
- Comparison fields: signal, criterion, rate or frequency, conditioning and heat cycle.
Glass Transition Temperature and Molecular Motion
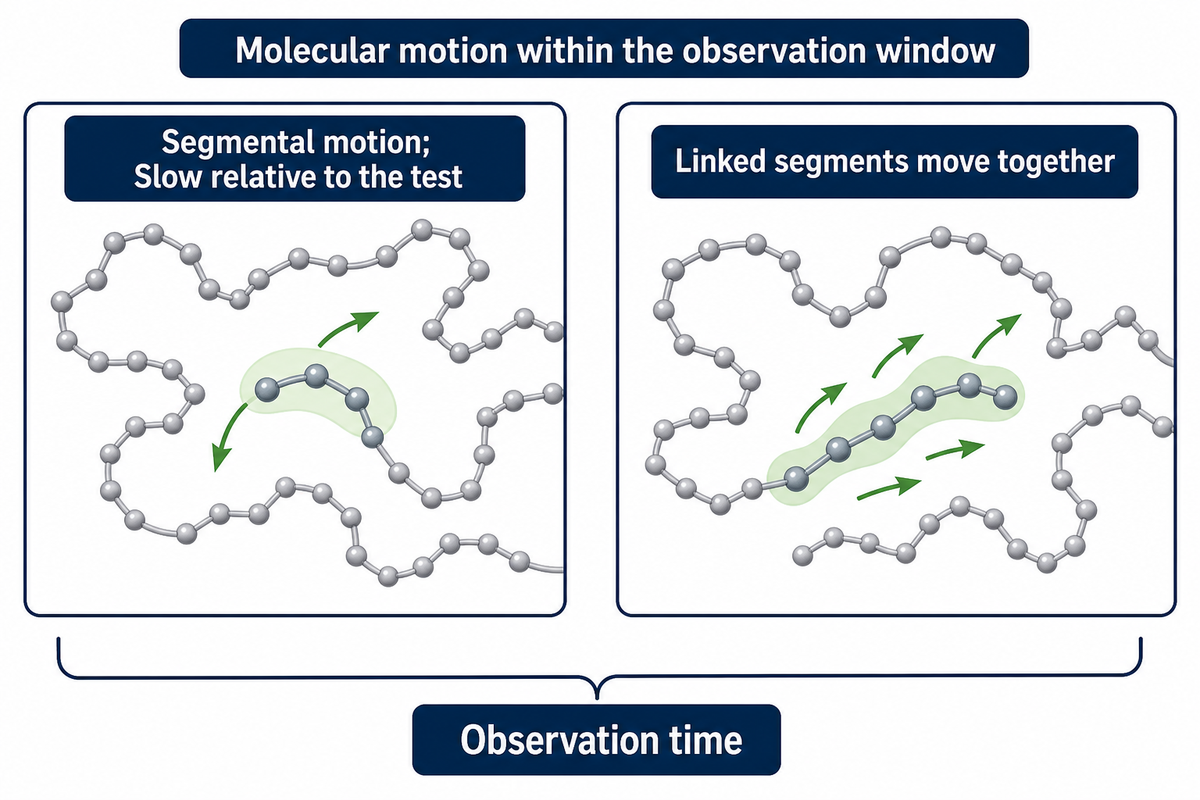
Within an amorphous polymer, glass transition reflects a change in segmental motion that becomes available during the measurement. Below that temperature range, segmental rearrangement is slow relative to the test. Above it, more segmental rearrangement can lead to the measured response. Atoms and smaller groups don’t become mobile from rest.
What is the glass transition temperature in polymers?
Tg is the temperature assigned to a transition from a glassy response to a more mobile amorphous response, under given measurement conditions. Polymer chains retain their chemical identity. The polymer changes its response as the time scale of the experiment becomes comparable to that of structural relaxation. Because that change spans a range of temperatures, the reporting convention selects a particular point.
Picture trying to rearrange a crowded length of chain, only to find the neighboring links also refusing to move. At the molecular level, several linked segments need to move together. Their motion is influenced by molecular structure and intermolecular interactions, as well as the presence of free volume. Free volume describes the space available; however, it doesn’t supply a value from a polymer name alone and thus can’t be used as a direct Tg estimator.
Many polymers can be found in a hard and brittle state below Tg, typically summarized by the phrase “hard and brittle below Tg,” but their mechanical properties can’t be simply described that way. The shape, stress and yield of a plastic can be influenced by a number of factors including the rate of loading, the type and amount of fillers and crosslinks. A glassy state doesn’t necessarily make a plastic impact resistant. Questions concerning the nature and properties of plastic can be answered by the plastic property interpretation guide.
Polymers well below their glass transition may still exhibit relaxation, or the motion of different segments of the polymer, over sufficiently long observation times. In O’Connell and McKenna’s NIST-listed research on polycarbonate relaxation segmental relaxation was shown to occur below the Tg. A supplier’s description of molecular chains as completely frozen takes a useful short-time picture too literally.
Tg and Tm in Amorphous and Semi-Crystalline Polymers
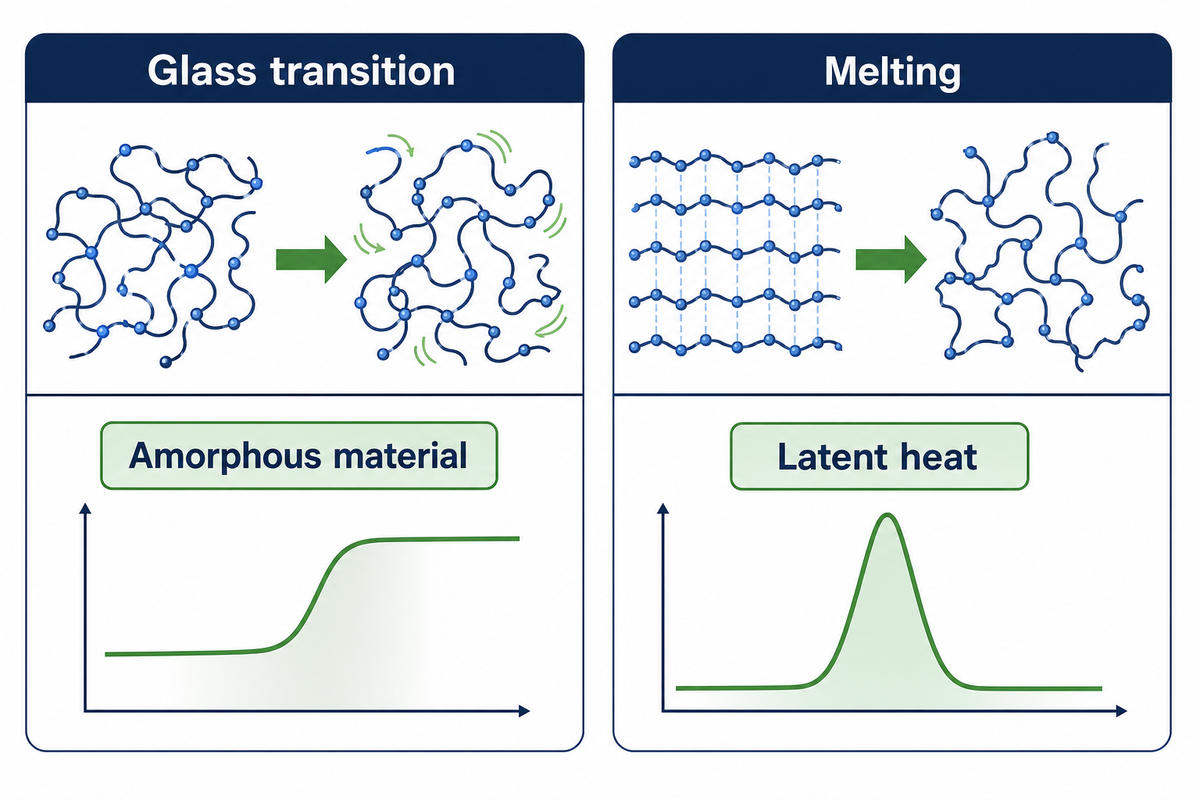
The amorphous material is of interest concerning the glass transition. The melting of ordered crystalline regions is of interest when considering a crystalline or partially crystalline structure. A semi-crystalline polymer can exhibit a glass transition and melting because it contains disordered regions and highly ordered portions. Crossing the glass transition doesn’t make the whole specimen a liquid. The melting temperature marks the temperature where crystalline regions lose their order.
What is the difference between melting temperature and glass transition temperature?
The melting of crystalline regions disrupts order and involves latent heat. The glass transition changes heat capacity and produces relaxation behavior. In a semi-crystalline thermoplastic, Tg is generally lower than the melting temperature. A fully amorphous material has no crystalline melting point to substitute for its glass transition, even though it may soften upon heating.
Common polystyrene grades illustrate amorphous behavior; polyethylene illustrates a family mostly used in a semi-crystalline state. Grade, copolymer composition and processing history still matter. As family-level reference points, a table of common plastics on ScienceDirect lists Tg at 95 °C for polystyrene, 70 °C for PET and −100 °C for both LDPE and HDPE; the specific temperature of a given grade can sit away from these values.
A polymer may change between a glassy and rubbery state during heating and cooling. This is a reversible transition, yet heating and cooling traces can differ because thermal history can distort the apparent step.
In thermodynamics, the melting of crystalline regions is an example of a first-order phase transition. Glass transition is explained in classroom examples using the language of a second-order transition to describe a change in properties such as heat capacity. The experimental behavior is actually kinetic and history dependent. You may not infer an equilibrium constant from that classroom label.
ISO 11357-2:2020 covers glass transition temperature and step height for amorphous and partially crystalline plastics. It keeps Tg and Tm distinct in a report. For crosslinked networks, the distinction is even more useful: a cured thermoset may undergo glass transition without becoming a freely flowing melt. For more information on thermosets and behavior, please refer to the companion explanation of thermoplastic and thermoset behavior.
Viscoelasticity: Why Time Changes the Apparent Transition
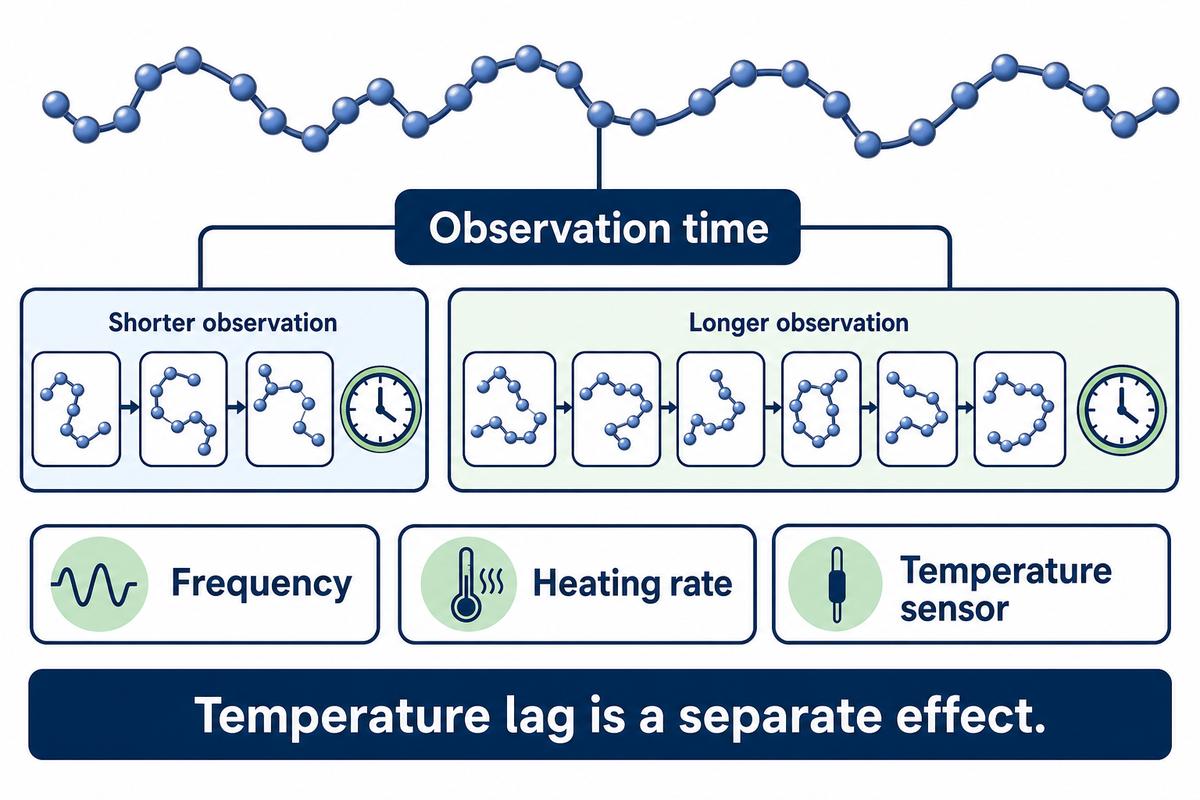
Time changes which molecular rearrangements can contribute to a polymer’s measured response. Faster loading allows less time for molecular rearrangement, whereas a temperature sweep changes the time spent near each temperature. A reported transition may occur at a different temperature when settings are changed, even if the formulation remains the same.
Viscoelasticity describes recoverable deformation and time-dependent loss of energy. In dynamic mechanical analysis, the instrument applies an oscillating deformation and measures the response versus temperature or frequency. A frequency described in hertz indicates cycles per second. Without that field, the reader can’t determine whether two mechanical measurements are made with comparable observation windows.
Billon and colleagues’ 2023 study of PMMA examined temperature dependence under various loading conditions. For this study, measurements of dynamic properties included frequency sweeps from 0.1 to 100 Hz at isothermal temperature steps. The researchers mentioned that the effects of shift factors could be dependent on loading mode; therefore, it can’t be generally assumed that a single shift factor can represent the missing test conditions.
The PMMA study reported a tensile specimen 30 mm long, 4 mm wide and 1 mm thick, with a 5 mm effective gauge length and a 1 °C/min temperature scan. These details show how much information disappears when a report is reduced to one temperature.
Theoretically, a heating rate effect can be described as the material responding to the observation time or the specimen lagging behind the temperature sensor. The second effect can be attributed to an experimental difference in the test temperature. Calling both effects “the polymer’s Tg changed” conceals what needs investigation.
For example, Yong and colleagues’ 2017 composite study used DMA heating rates of 3, 5 and 10 °C/min at 1 Hz. Thickness and temperature correction affected interpretation. When purchasing receives results made at different rates, quality staff should request the programs and temperature measurement details before asking either laboratory to defend its number.
Reading DSC Heat Capacity Steps
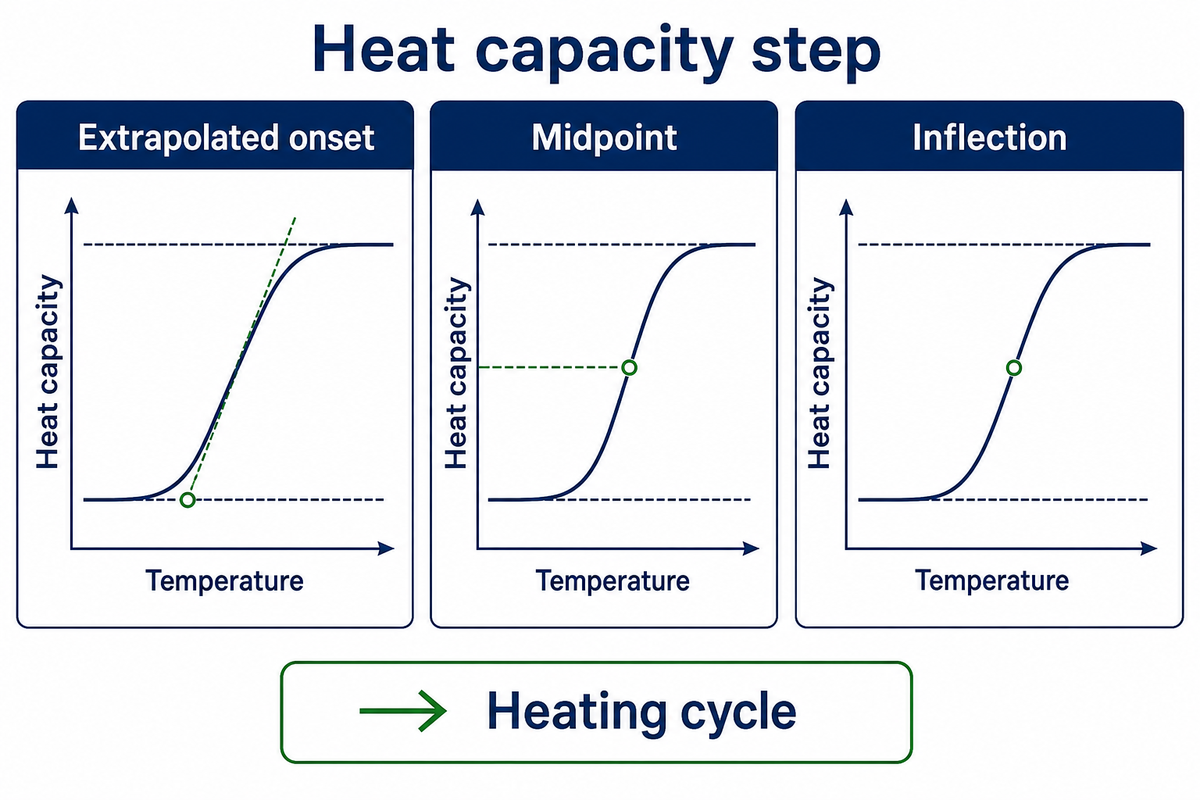
A glass transition in DSC is shown by a step change in the baseline associated with change in heat capacity. In order to assign Tg, an analyst interprets the step in a particular way. Different constructions of the step define different temperatures, and a temperature copied off a graph is of little value in the absence of a clear statement in the report about the construction that defines the temperature.
“The glass transition is manifested as a step change in specific heat capacity.”
How do you read glass transition temperature from DSC?
Look for heat capacity steps, inspect baselines before and after the steps, and examine how reported curves are constructed. See if the trace comes from the first or from a later heating cycle. Identify the temperature that corresponds to the stated criterion. An endothermic peak or a curing feature near the Tg shouldn’t be assumed to be Tg.
An extrapolated onset of transition uses the pre-transition baseline and a rising step. A midpoint of a step refers to a height of the step divided by two. An inflection is a change in curvature, and is often associated with the steepest part of a trace. Symmetrically placed midpoint and inflection markers on a curve don’t always represent interchangeable definitions.
The apparent step can be distorted by thermal history. Physical aging below Tg may lead to enthalpy recovery during subsequent heating, thus resulting in an overshoot that spans the transition. Removing some of the thermal history by performing a second heating may lead to different results, and the second heating may also alter the question being asked. The result, therefore, provides information on the specimen that has already been through the thermal procedure at the laboratory.
Thermal history and moisture may affect Tg analysis and are described in depth in Newman and Zografi’s 2019 discussion of amorphous pharmaceutical solids. Their reasoning may also help clarify thermal analysis. Pharmaceutical sample preparation practices and a packaging recipe may be very different. A sealed pan that retains water and a vented pan that loses water may represent very different physical states.
- Identify the specimen: record grade, conditioning and any drying treatment.
- Locate the step: separate the baseline change from overlapping peaks.
- Read the criterion: retain onset, midpoint or inflection beside the value.
- Check the program: retain heating rate, cooling rate and heat-cycle number.
The rate is part of the result. Yong’s composite investigation compared DSC programs at 5, 10 and 20 °C/min and didn’t recommend one particular rate for all polymer systems. If a supplier sends only a portion of the curve, request the full thermal program before accepting a temperature as equivalent to the specification.
Bair’s 1994 ASTM paper on Tg assignment illustrates the temperature-measurement problem with a particular polycarbonate experiment: a 0.6 mm specimen weighing 17 mg, heated at 15 °C/min. Reported gradients were no greater than 0.6 °C in that setup.
A faint or distorted step can still belong to a glass transition; complex conditions can make it hard to detect. ASTM E1356-25 deals with stable amorphous or partially crystalline materials; a trace affected by decomposition needs separate interpretation and should not be assigned Tg through a more confident cursor placement.
Reading DMA Storage Modulus and Damping Curves
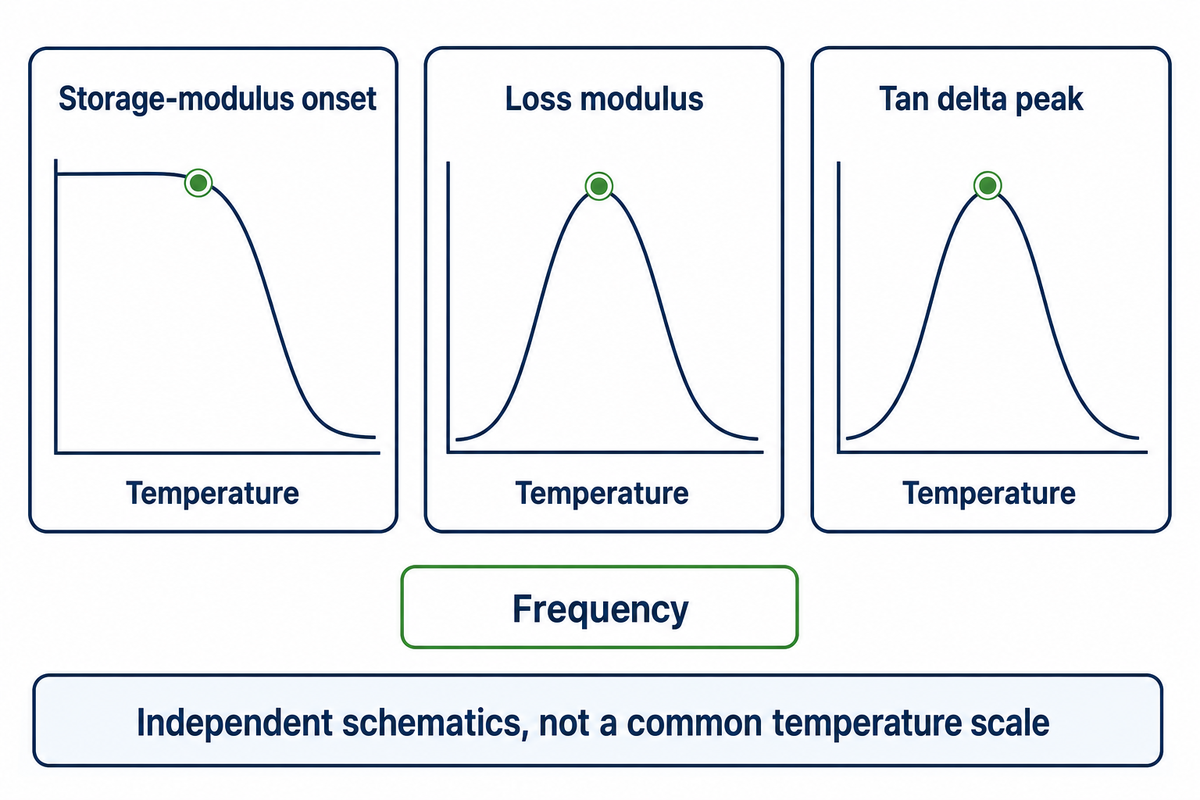
DMA assigns the glass transition using different features of the mechanical response. Loss modulus describes the irrecoverable (or dissipative) part of the response, and tan delta (or loss-to-storage ratio) describes the loss; storage modulus describes the recoverable part. The onset of modulus loss and the loss modulus peak don’t have to occur at the same temperature.
Read the curve name first. A tan delta peak can’t be labeled as a storage-modulus onset. Nor does the presence of three markers allow their averaging to give a more accurate Tg. Each marker describes a different aspect of glass transition behavior.
ASTM E1640-23 calls the onset of the storage-modulus decrease an ideal assignment and acknowledges technique dependence. The public standard description does not, in general, assign a fixed numerical offset between DSC and DMA. It indicates that the transition spans a range, even if a particular value is specified.
There must be equal consideration given to the manner in which the specimens are prepared and handled. Tension and shear don’t produce the same kind of deformation. Geometry, clamping and the direction of the specimen should be given with the frequency and rate of heating in a useful report. An instrument that’s capable of running a film specimen has, in and of itself, not established a valid mechanical comparison.
In the 2017 Yong study, single-cantilever DMA used a 10 µm displacement amplitude on composite specimens 10 mm wide and 35 mm long. Tested thicknesses ranged from 0.25 mm to 4 mm. Very thin specimens of one tested system, 0.25 and 0.5 mm thick, gave noisy flexural results. That finding warns about a particular material and fixture; it doesn’t impose a minimum thickness on every polymer film or rule out a tensile fixture.
The same study considered a storage-modulus inflection alongside loss and damping peaks. Its inflection criterion must remain distinct from the ideal onset described by ASTM E1640-23. When a laboratory reports “DMA Tg” without naming the marker, ask for the curve and analysis convention before treating the result as a disagreement about material quality.
Why Reported Tg Values Shift
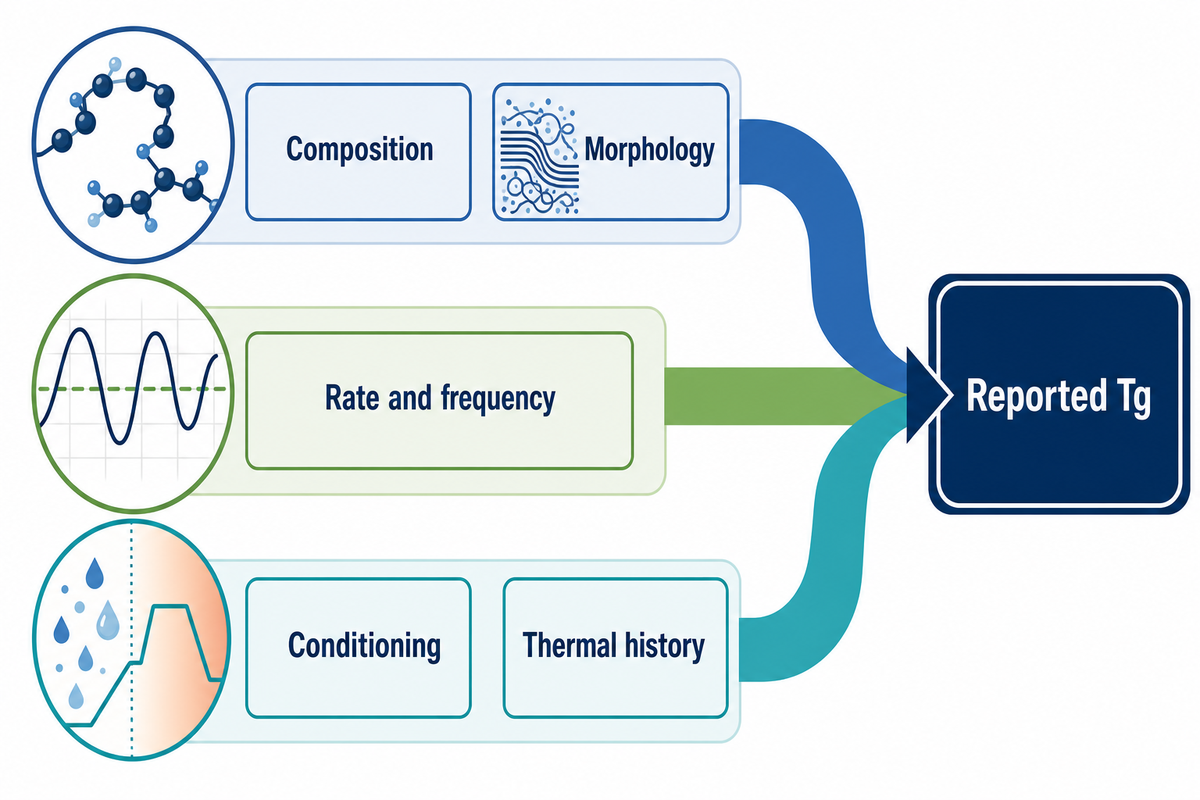
Tg values can shift for many reasons. For example, the material or the measurement could change. The segmental mobility of the material changes with the overall composition and/or the morphology of the material. The rate, frequency and curve construction affect how segmental mobility is measured. The specimen can change from prior moisture content and/or physical aging and/or prior thermal history. Separating the individual causes of the shift is more useful than applying a simple temperature correction.
Molecular weight, copolymer composition and chain interactions play a role in determining thermal properties and other physical properties. Absorbed moisture, plasticizers and the state of cure in a real product can also contribute to differences. The statement “glass transition temperature depends on molecular structure” is correct, but lacks detail to fully explain a particular pair of supplier reports.
The authors give a concrete example in the 1994 study of oriented PET by Moscato and Seyler, where seven films came from the same extruded source but underwent different drawing processes. The Tg values were determined to be in the range from 70 to 94 °C, dependent on the measurement and the draw process. The range belongs to that study; it isn’t a specification for all PET films.
The authors of the study also mentioned the presence of both mobile and restricted amorphous domains and how they affected the final outcome. Drawing and heat setting can change how amorphous regions interact with the surrounding structure. A result measured in one direction can miss behavior relevant to another direction. It’s important to retain the film’s heat-set and drawn state when asking for a comparison.
A second PET study by Sellarès and colleagues focused on secondary crystallization after a 4-hour anneal between 140 and 180 °C. It related changes in the interlamellar amorphous response to the surrounding morphology. The annealing conditions described in that study shouldn’t be generalized to other studies. Secondary crystallization and physical aging shouldn’t be used interchangeably.
Conditioning records typically serve as a starting point. Ask if each specimen was tested as received, dried, equilibrated or measured after a humidity cycle. The guide to recording film conditioning helps organize those fields. A certificate with no conditioning history leaves the comparison incomplete, even if both laboratories used the same instrument family.
What Higher Tg Can and Cannot Tell You
A higher Tg means the selected transition marker occurred at a higher temperature under the defined conditions. However, that doesn’t necessarily indicate increased stiffness, longer life, or safer operating temperature. Those conclusions require evidence pertaining to the property, loading, environment and duration of interest.
What does higher Tg mean?
For comparable specimens measured by the same method, higher Tg means the segmental transition occurred at a higher temperature. Polymers with high Tg may retain a glassy response where a low Tg material has already undergone its transition. The inference stops short of product approval: crystallinity, reinforcement, conditioning and time-dependent deformation can all affect material performance separately from the transition marker.
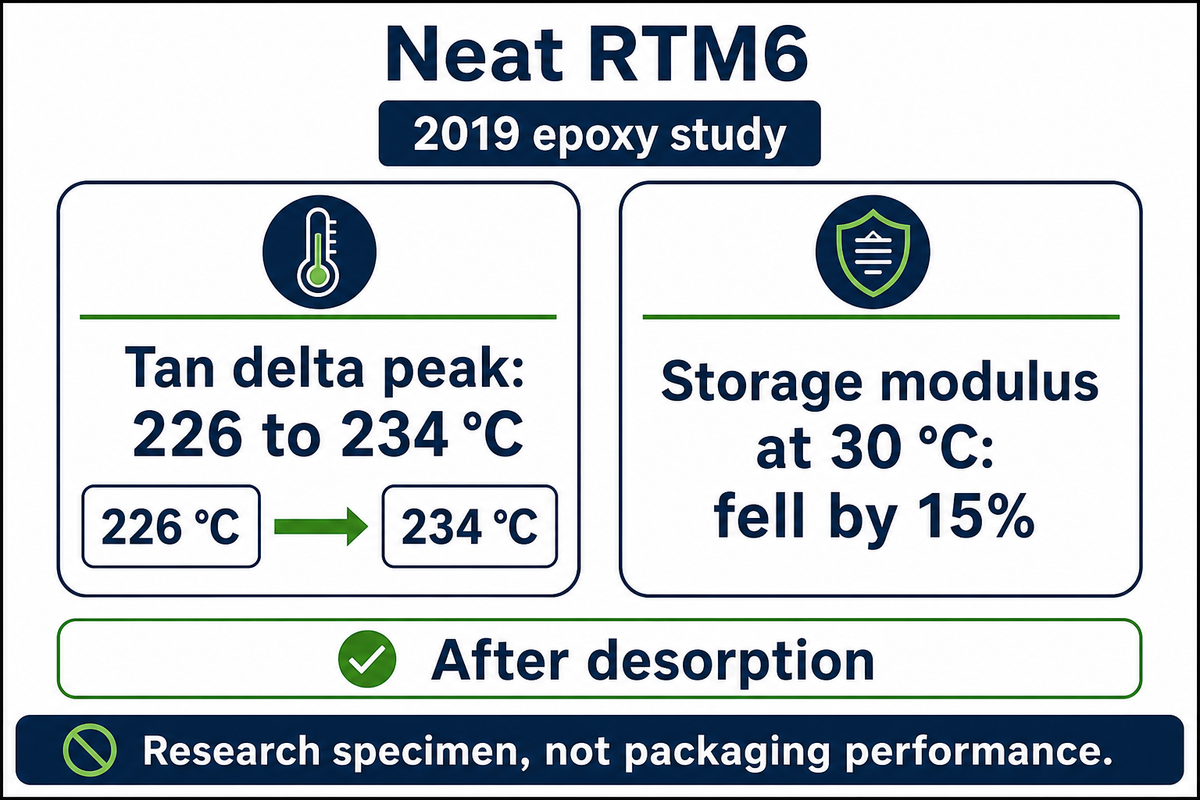
A useful counterexample comes from Glaskova-Kuzmina and colleagues’ 2019 epoxy study. Neat RTM6 specimens underwent a 24% → 91% → 24% relative-humidity cycle at 20 °C, with equilibration at each stage. After desorption, the tan delta peak increased from 226 to 234 °C, while storage modulus at 30 °C fell by 15%.
Those results used tensile DMA at 10 Hz and a 3 K/min heating rate, with a 4 N load on nominal specimens 30 mm long, 3 mm wide and 1 mm thick. They describe a desorbed epoxy after a humidity cycle, not an in-service wet packaging film. The researchers discussed possible structural changes; the data alone don’t prove one mechanism. Nevertheless, the paired results directly show why a higher glass transition temperature can’t stand in for retained stiffness.
Temperature behavior under load requires its own evidence. For a loaded product, request the mechanical evidence for the intended operational temperature range. Duration belongs with that evidence request. The explanation of time-dependent creep under load answers a question that a single Tg can’t resolve.
Choosing Thermal or Mechanical Evidence
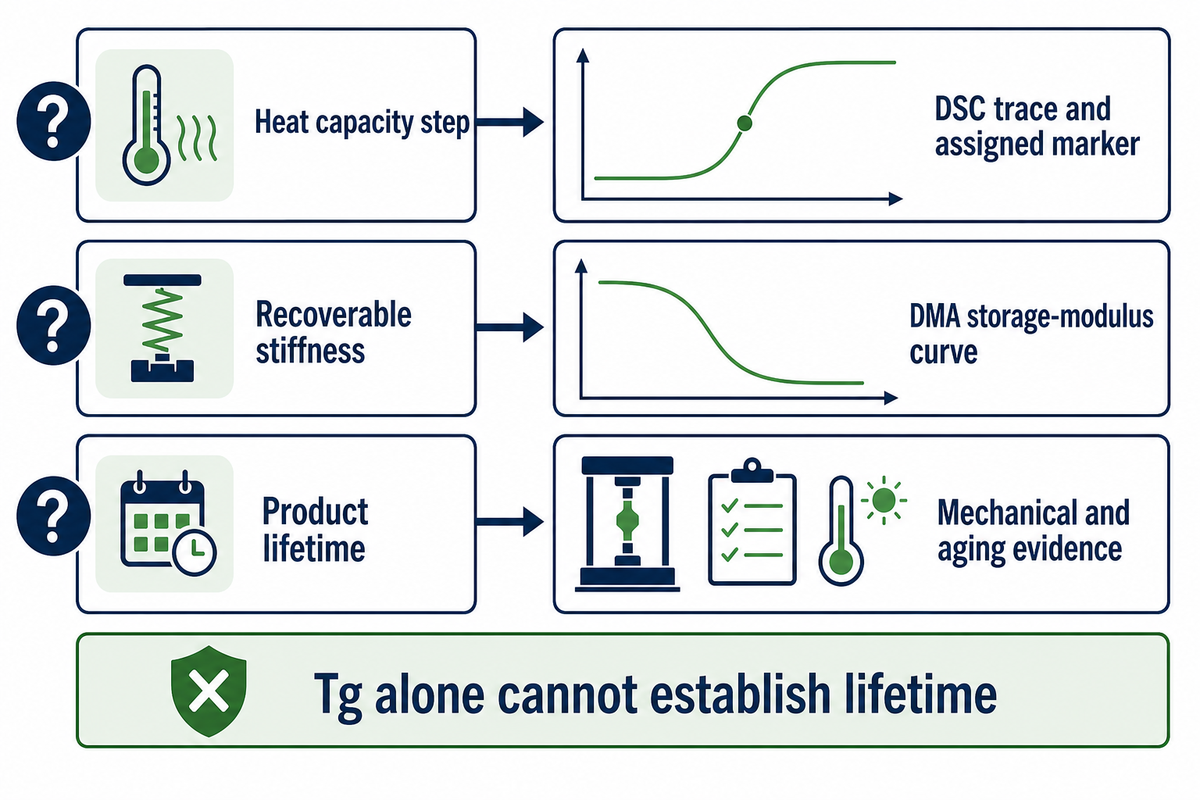
For the property question and specimen, select a Tg measurement and retain its reporting criterion. There are different observables to consider, and a convenient instrument can’t resolve which observable is critical. In addition, a thin specimen doesn’t necessarily warrant the use of DMA.
| Evidence category and decision question | Evidence to request | Metadata that makes it interpretable | Boundary |
|---|---|---|---|
| Calorimetric midpoint: where is the middle of the heat capacity step? | DSC trace and assigned marker | Heating rate in °C/min; heat cycle; pan and conditioning | An overlapping peak is not automatically Tg |
| Where does recoverable stiffness decline? | DMA storage-modulus curve | Frequency in Hz; rate in °C/min; fixture, dimensions and direction | Keep onset distinct from inflection |
| Where is mechanical damping greatest? | DMA tan delta curve | Frequency in Hz; strain or amplitude; analysis criterion | A damping peak does not specify retained stiffness |
| How does a part change dimensions? | Dimensional response or thermal expansion measurement | Direction, force, temperature program and coefficient convention | Do not silently substitute a dimensional marker for calorimetric Tg |
| Calorimetric onset: where does the constructed step begin? | DSC trace with extrapolated baseline and tangent | Heating rate in °C/min and construction convention | Do not replace it with the midpoint |
| Calorimetric inflection: where does step curvature change? | DSC trace and inflection assignment | Smoothing, baseline and analysis settings | Coincidence on a schematic does not prove equivalence |
| Mechanical loss: where is dissipative response greatest? | DMA loss-modulus curve | Frequency in Hz and specimen geometry | Keep the loss-modulus peak separate from tan delta |
| Will a loaded product last? | Application-specific mechanical and aging evidence | Load, duration, temperature and environment | Tg alone cannot establish lifetime |
The first two routes describe observables of ASTM E1356-25 and ASTM E1640-23. Remaining rows are guidance on evidence selection. These do not demonstrate that either standard verifies a finished package. Use the guide to selecting plastic test evidence if the scope goes beyond thermal transitions.
A narrow caution comes from Soles and colleagues’ NIST work on highly confined polymer films: different probes yielded differing impressions on the confined dynamics. That work addresses strong confinement. It shouldn’t be extrapolated to ordinary packaging gauges or used to mandate a particular instrument of analysis without checking the sample.
A 3-Axis Tg Comparison Map for Supplier Reports
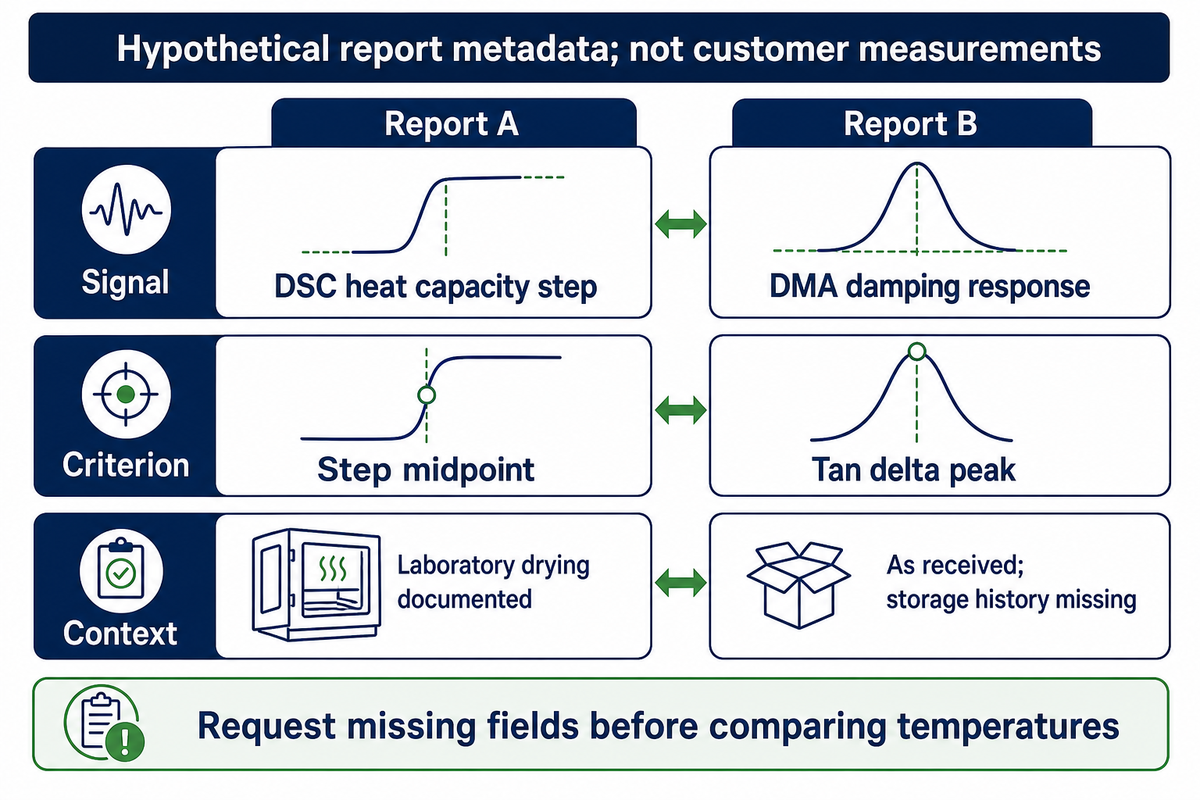
Compare supplier reports along the three axes of the measured signal, assigned curve criterion, and the specimen’s test context. An alignment is achieved only if all the relevant fields match. Incomplete comparison is given if fields are left unspecified, and a mismatch is given if different signals or criteria are used. None of these labels are an endorsement of the material.
The examples in the table below are an editorial compilation based on the cited measurement literature. The two example columns illustrate hypothetical report metadata. They aren’t UD Packaging tests, recommended protocols or measured Tg values.
| Axis and field | Example report A | Example report B | Next request |
|---|---|---|---|
| Signal | DSC heat capacity step | DMA damping response | Choose the signal required by the specification |
| Criterion | Step midpoint | Tan delta peak | Retain both labels; do not average the results |
| Heating program | 10 °C/min | 2 °C/min | Request full programs and temperature conventions |
| Frequency | Not applicable to this conventional DSC scan | 1 Hz | Preserve the mechanical observation time |
| Thermal history | Second heat; preceding cooling recorded | First temperature sweep | Decide which specimen history answers the question |
| Conditioning | Laboratory drying documented | As received; storage history missing | Resolve sample-state differences |
| Specimen direction | Sample cut location recorded | Machine direction in tension | Confirm direction and processing state |
| Trace availability | Trace and baseline construction attached | Peak temperature only | Request the mechanical curves |
Staff can use the worksheet to identify missing fields before commissioning the next test. Procurement can demand a common reporting framework instead of ranking unlike numbers. The engineering staff can add the load and temperature with the duration of the exposure which defines the actual operating condition. Those responsibilities are separate though one person can perform all three roles.
Direction is particularly important for drawn products. Report film specimen direction together with the drawn and heat-set state, as done in the oriented-PET study. For discussion of UD Packaging PET strapping, identify the actual product grade and the required performance of the package. The importance of glass transition lies in better insight into interpreting evidence. This knowledge guide isn’t to state the product’s Tg or provide any testing service.
Key takeaway
Use the 3-Axis Tg Comparison Map to align signal, criterion and context before comparing temperatures. Request the missing report fields first; use application-specific evidence to judge performance.
Frequently Asked Questions
Common questions about glass transition concern material state, temperature units and how a reported value is obtained. The answers below keep those meanings separate. For method scope, ISO 11357-2:2020 addresses calorimetric glass transition temperature and step height in amorphous and partially crystalline plastics.
Do thermosets have a glass transition temperature?
Yes. Their crosslinked networks can contain amorphous material that undergoes glass transition.
Passing through that transition changes segmental mobility and mechanical response, but it does not turn a cured network into a freely flowing thermoplastic melt. The measured result can also depend on cure history and subsequent exposure. Compare specimens with a stated cure schedule, conditioning history and test method rather than using a resin name alone to predict their behavior.
Can glass transition temperature be negative?
Yes. A glass transition can occur below zero degrees Celsius; a reference table of common plastics lists polypropylene at −25 °C and LDPE at −100 °C.
A negative Celsius value does not imply a negative absolute temperature or an error in the test. At a lower temperature, the same material may respond differently. Celsius uses a conventional reference point, and polymers can have mobile amorphous segments at room temperature. Interpret the value together with the temperature scale, measurement method, composition and physical state instead of treating a negative sign as a quality rating or a rejection criterion.
Why is it called glass transition?
The name describes a transition involving the rigid response of a glassy state.
A disordered material responds as a rigid solid when structural relaxation is too slow for the observation period. Heating allows larger scale segmental motion to contribute to the response. The term does not require the specimen to be transparent window glass, and it does not mean that ordered crystals are melting at that temperature. Appearance alone cannot identify the transition.
What are the units of glass transition temperature?
Read the answer
Reports commonly give Tg in degrees Celsius or kelvin. Check the stated scale before comparing values, and retain the measurement method and curve criterion beside the temperature.
How do I calculate the glass transition temperature?
Read the answer
For a measured specimen, Tg is usually assigned from a recorded response using a stated curve construction. It is not obtained from a universal equation using only a polymer name. In differential scanning calorimetry, the analysis may use an onset or a midpoint construction on the heat capacity step. Dynamic mechanical analysis uses different features of storage modulus, loss modulus or damping. For defined polymer systems, composition models estimate Tg: the Fox equation uses the weight fractions and Tg values of two components and only works when they are compatible; such models cannot convert a DSC value into a DMA value. If you receive a graph without its test program or reporting convention, request those details before extracting a number. For a contractual comparison, agree on the method, sample preparation, curve criterion and reporting units first. Then apply the same construction to each valid trace.
In the process of comparing alternatives? Start with the plastic properties reference hub, define the performance question and carry the signal, criterion and context fields into your next supplier request.
Related Articles
References & Sources
- ASTM E1356-25: glass transition temperatures by DSC. Public scope and significance sections, 2025.
- ASTM E1640-23: assignment by dynamic mechanical analysis. Public significance and scope, 2023.
- ISO 11357-2:2020: DSC glass transition temperature and step height. Edition 3; confirmed in 2025.
- O’Connell and McKenna: segmental relaxation below Tg. NIST publication record.
- Billon and colleagues: PMMA temperature and loading-rate response. Original research, 2023.
- Yong and colleagues: heating-rate effects in composite thermal analysis. Original research, 2017.
- Newman and Zografi: glass transition in pharmaceutical amorphous solids. Commentary, 2019; scope limits stated above.
- Bair: assignment of glass transition temperatures. ASTM research publication, 1994.
- Moscato and Seyler: assigning Tg in oriented PET. ASTM research publication, 1994.
- Sellarès and colleagues: secondary crystallization in PET. Published research manuscript, 2010.
- Glaskova-Kuzmina and colleagues: epoxy moisture absorption and desorption. Original research, 2019.
- Soles and colleagues: dynamics of highly confined polymer films. NIST publication record, 2002.
Editorial method: public standards summaries and scholarly literature were compared to distinguish measurement definitions from application claims. Research results belong to the named authors. No original UD Packaging measurements are presented.